A few weeks ago I added structured logging to the NestJS API I'm building. It felt like a small, almost boring change — swap console.log for a logging library, done. Instead it turned out to be one of the highest-leverage decisions I've made on the project so far. Once the logs had structure and context, a dozen other things — debugging, tracing, and eventually shipping data to an observability tool — suddenly became possible instead of theoretical.
This post is what I wish someone had explained to me before I started: not just "use pino," but why each piece of a good logging setup exists, and what problem it's actually solving.
Why logging matters more than it seems to
Early in a project, logging feels optional. You have one process, you can attach a debugger, you can read console.log output scrolling past in a terminal and mentally piece together what happened.
That stops working the moment your system has more than one thing happening at once — concurrent requests, background jobs, retries, a request that touches three internal calls before it fails. At that point, logs stop being a debugging convenience and become the only record of what your system actually did. You weren't there when it happened. You can't step through it after the fact. The log is the evidence.
This matters even more in production because production is the one environment you can't fully reproduce locally. The specific combination of load, timing, and data that caused a bug often only exists once, in production, at 2am. If your logs don't capture enough context to reconstruct that moment, the bug is effectively unsolvable — you're reduced to guessing.
So the real question isn't "should I log things." It's "will my logs let me answer questions I haven't thought to ask yet." That reframing is what pushed me toward structured logging instead of ad hoc print statements.
AsyncLocalStorage: how a per-request logger works without threading context everywhere
Here's a problem that's easy to underestimate: in a request-response cycle, a single request typically flows through a middleware, a guard, a controller, a couple of services, and maybe a repository layer. If I want every log line from that request to carry the same request ID, I'd normally have to pass that ID as a parameter into every single function call along the way. That's invasive, easy to forget, and it pollutes function signatures with a concern that has nothing to do with their actual job.
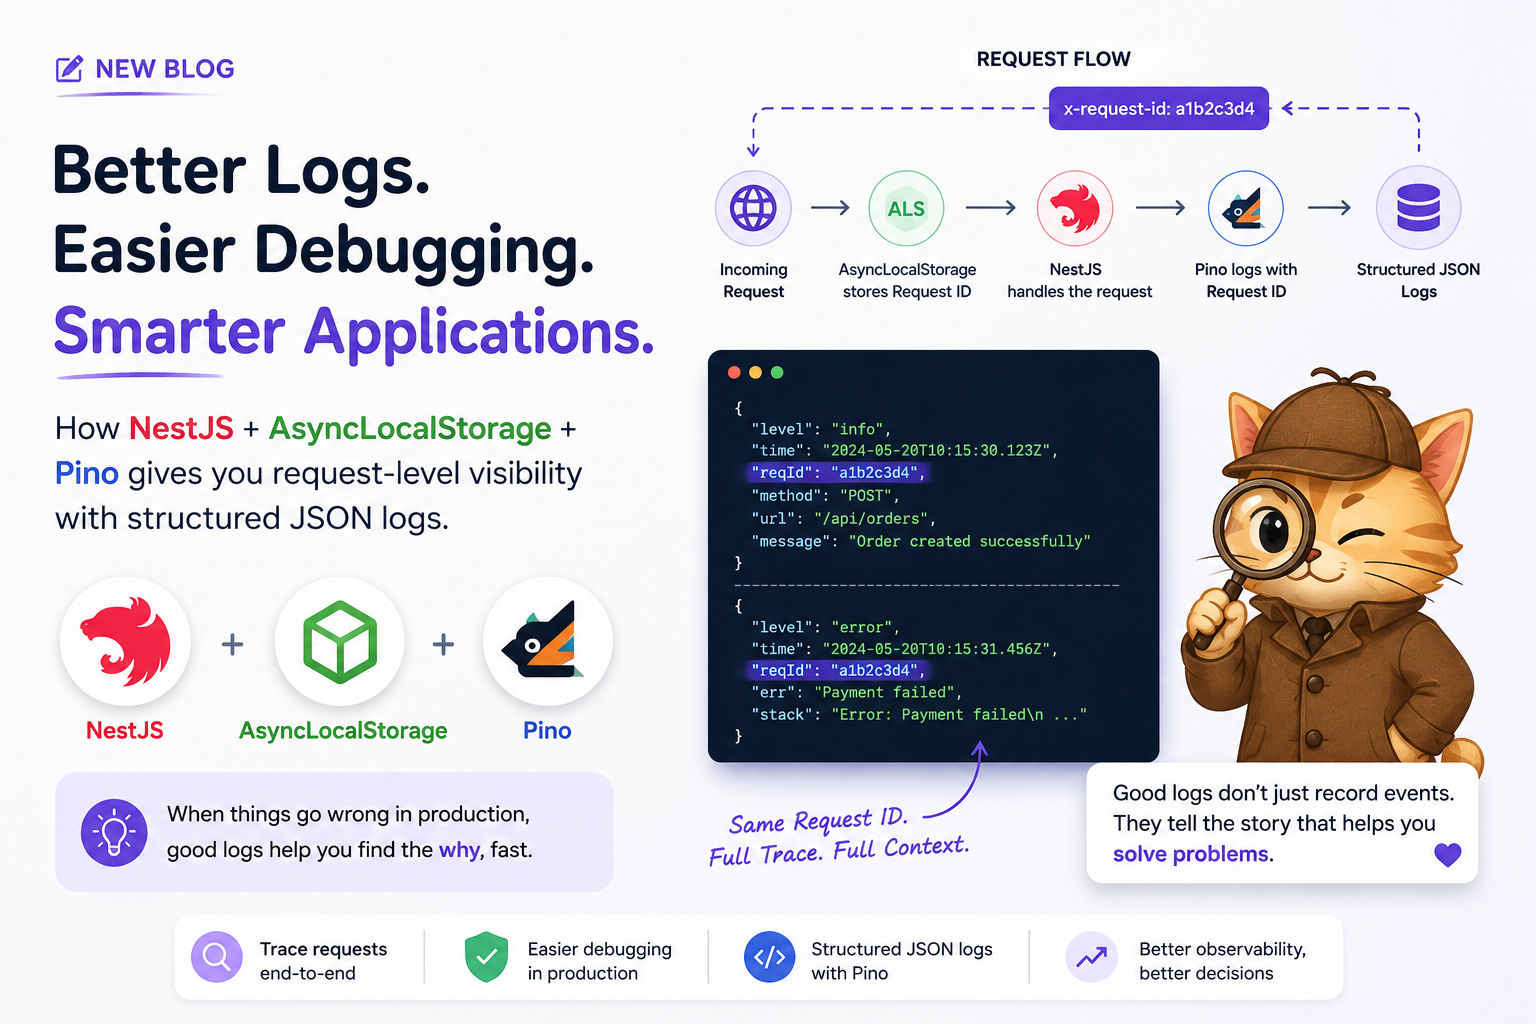
This is exactly the problem Node's AsyncLocalStorage (ALS) solves, and it's what nestjs-pino uses under the hood. ALS lets you create a "store" — think of it as context that rides along with an async execution chain — without explicitly passing it as an argument. A middleware runs at the start of a request, creates a store containing a request ID (and anything else you want attached), and every piece of code that executes within that async chain — including code several awaits deep — can reach back into that store and read the request ID, with zero plumbing.
Practically, this means nestjs-pino gives you a request-scoped logger. The setup is a single module registration:
// app.module.ts
import { LoggerModule } from 'nestjs-pino';

@Module({
  imports: [
    LoggerModule.forRoot({
      pinoHttp: {
        level: process.env.LOG_LEVEL ?? 'info',
      },
    }),
  ],
})
export class AppModule {}
And then in any service, you inject the logger like any other provider — no manual context passing required:
// orders.service.ts
import { Logger } from 'nestjs-pino';

@Injectable()
export class OrdersService {
  constructor(private readonly logger: Logger) {}

  async createOrder(userId: number) {
    // ...
    this.logger.log({ userId }, 'order created');
  }
}
Call createOrder from an HTTP request and the resulting log line already has the request ID attached — because pino pulled it out of the ALS store, not because you passed it in.
The elegance here is that request context becomes ambient rather than explicit. Your business logic stays clean; the logger silently carries the "who, when, in response to what" context along for the ride.
Why stdout, not files
When I first thought about "where do logs go," writing to a file felt like the obvious answer — open a file, append lines, done. In production, that's actually the wrong instinct, for a few concrete reasons:
- Containers are ephemeral. If your app runs in Docker or Kubernetes, the filesystem inside a container can disappear the moment the container is replaced. A log file written inside that container is gone with it, unless you've set up a persistent volume — which adds complexity you usually don't need.
- File writes introduce responsibilities you don't want. Rotation, disk space limits, file permissions, concurrent writes from multiple processes — all of this is solved, better, by tools that already exist for this exact job.
- The platform is already watching stdout. Docker, Kubernetes, and most process managers capture whatever a process writes to stdout/stderr automatically. That's the entire mechanism they use to know what your app is saying. If you write structured JSON to stdout, you get log collection "for free," and you can point a log driver or a sidecar (Fluent Bit, Vector, Promtail, whatever your stack uses) at that stream to forward it into Loki, CloudWatch, Datadog, or Elasticsearch — without your application code knowing or caring where the logs ultimately end up.
This is the core idea behind treating logs as a stream, not a file: your app's only job is to emit structured events to stdout. Deciding where those events are stored, indexed, and queried is infrastructure's job, not application code's job. That separation is what lets you swap observability backends later without touching a single line of app code.
Concretely, the difference is this. What you don't want:
// Anti-pattern: app manages its own log file
fs.appendFileSync('logs/app.log', JSON.stringify(logEntry) + '\n');
What pino does by default — write JSON straight to stdout, and let the platform decide where it goes:
$ node dist/main.js
{"level":30,"time":1752569700000,"msg":"Nest application started","context":"NestApplication"}
Then, separately, on the infra side, a Docker log driver or Kubernetes log agent scoops up that stdout stream and forwards it wherever you want — no app code changes required if you later switch from, say, CloudWatch to Loki:
# docker-compose.yml
services:
  api:
    build: .
    logging:
      driver: awslogs
      options:
        awslogs-group: my-api
Why the JSON format is the actual unlock
Pino's default output is a JSON object per log line, not a formatted string. At first this looks worse — a raw JSON blob is harder to read than a nicely formatted sentence. But that's exactly backwards for production, where a human isn't reading logs live in a terminal; a query engine is.
Compare:
[Nest] 12345 - 07/15/2026, 10:22:14 AM LOG [OrdersService] Order 8841 created for user 512 in 42ms
against:
{"level":30,"time":1752569734000,"reqId":"a1b2c3d4","context":"OrdersService","msg":"order created","orderId":8841,"userId":512,"durationMs":42}
The first is fine for a human eyeballing a terminal. The second is a record — every field is queryable independently. "Show me every request from user 512 that took longer than 500ms" or "how many orders failed in the last hour, grouped by error code" become simple filter/aggregate queries against structured fields, instead of regex archaeology against free text. This is the difference between logs being something you read and logs being something you can actually analyze — which is the whole point of having an observability tool in the first place.
Request IDs: the thread that ties a story together
A single request in a real system rarely produces one log line. It produces several — one at the point it enters your API, more as it touches the database, the cache, maybe an external service, and one at the point it responds or fails. Individually, none of these lines tell the full story. Together, they do — but only if you can group them.
That's what a request/correlation ID is for. By generating an ID at the edge of the system (or reading one that was already generated upstream, if you're behind a gateway or calling another service) and attaching it to every log line produced while handling that request, you turn a scattered pile of log entries into a single traceable narrative. When something goes wrong, you don't start by guessing — you start by pulling every log line with that request ID and reading the request's entire life story in order.
This becomes even more valuable the moment you have more than one service. If a request ID is generated at the edge and propagated forward — through headers, through queue messages, through whatever hands work off to another process — you can trace a single user action across service boundaries, not just across function calls within one process. That's the foundation that distributed tracing tools build on top of; even without a full tracing system, propagated request IDs get you most of the practical benefit for a fraction of the setup cost.
Getting this is mostly one config option — nestjs-pino will reuse an incoming x-request-id header if one exists (useful if a gateway upstream already generated one), or generate a fresh one if not:
LoggerModule.forRoot({
  pinoHttp: {
    genReqId: (req) => req.headers['x-request-id'] ?? randomUUID(),
  },
});
From there, every log line tied to that request — across every service and every layer — carries the same reqId, so pulling the full story is just a filter: reqId:"a1b2c3d4".
The part that's easy to forget: security
Structured logging makes it very easy to log more than you meant to. Once you're logging entire request bodies or objects for context, it's a short step to accidentally logging a password field, an auth token, a card number, or other PII — and once that's in your log aggregator, it's often replicated to multiple systems, retained for months, and much harder to scrub than it was to prevent in the first place.
The fix isn't "be careful" — it's configuring the logger to be careful for you. Pino supports a redact option where you declare paths that should never make it into the output, and it replaces the value with [Redacted] regardless of what's actually there:
PinoLoggerModule.forRoot({
  pinoHttp: {
    redact: {
      paths: [
        'req.headers.authorization',
        'req.body.password',
        'req.body.creditCard',
        '*.token',
      ],
      censor: '[Redacted]',
    },
  },
});
Treating this as a checklist you maintain deliberately — rather than trusting individual developers to remember not to log secrets — is what actually prevents leaks at scale. It's a small amount of upfront configuration that removes an entire category of production incident from the table.
Where this leaves me
None of these six pieces matter much in isolation. What made the difference for me was seeing how they compound: ALS gives you context without plumbing, JSON gives that context a shape a machine can query, stdout gets it out of your app and into infrastructure you don't have to build, request IDs stitch scattered lines back into a story, and redaction keeps the whole pipeline from becoming a liability. Put together, logging stops being "print statements with extra steps" and starts being what it actually is: the observability layer your production system runs on.
The next step for me is deciding where these logs actually go — which is really a question about what I want to be able to ask later, not just what tool looks good on a dashboard. But that's a good problem to have, and it only became askable because the logs finally had the structure to support it.